Retirement planning
Retirement planning with the math attached.
Most money apps tell you what you spent last Tuesday. Almost none answer what actually keeps you up at night: Can I retire at 62? Roth-convert this year? Wait until 70 for Social Security? If I retire before 65, how do I afford health insurance until Medicare?
These are the questions you’d hire a planner for — and GlidePath is built around them. Every projection shows the formula, the assumptions, and a plain-English “here’s why,” so the answer’s never a black box you take on faith.
“Trackers tell you what happened. GlidePath helps you decide what to do next.”
Planning room signals
A good projection should know when it deserves a second look.
GlidePath does not treat the planner as a separate calculator. The Plan room reads from the same household basics, imports, accounts, and obligations as the rest of the app, so the first question is not just "what does the chart say?" It is "are the facts fresh enough to trust the chart?"
Freshness
The plan knows when the inputs are getting old.
A retirement projection is only as useful as the balances and imports underneath it. Plan-room signals call out stale readings before you treat a precise answer like a current one.
Household basics
The app learns the assumptions most tools make you remember.
Household type, retirement ages, income, health-coverage bridge, and account mix sit underneath the planner so the signals can tell you what is missing before the math gets fancy.
Ask Glide
Ask why the number moved.
When a signal or projection changes, Ask Glide can explain the local facts behind it and point you back to the screen where the assumption lives.
Decision Studio
Compare moves without turning the app into an advisor.
Saved plan versus modeled alternate: success probability, ending balance, tax effect, and bridge costs shown together, with the decision still labeled as yours.
The questions, one at a time.
Each one comes with a quick "what this really means," so the technical name isn’t a wall.
Monte Carlo
Will my money last?
One honest number is impossible — the future’s too uncertain. So instead of guessing, we run your plan through 1,000 randomized return paths around your expected return and volatility (that’s Monte Carlo simulation). Each path reshuffles the good and bad years, so a crash early in retirement hurts far more than the same crash late — the sequence-of-returns effect the worst paths capture. You get a fan chart of where you might land in the typical case and in the worst-decile tail — the part few tools surface, and the part that matters.
Roth conversions · Tax Valley
When should I do Roth conversions?
“Tax Valley” is shorthand for a simple idea: the years between when you stop working (income drops) and when Social Security + Required Minimum Distributions start (income comes back up) are often lower-tax years. Roth conversions in that window can make sense for some households, but only after seeing the bracket room, Social Security tax-torpedo effect, IRMAA cliffs, and survivor-tax pressure together. We find your specific Tax Valley years, show how much bracket headroom you have, and estimate the tradeoff without telling you to convert. See the Roth conversion calculator →
ACA bridge
If I retire early, can I afford health insurance until Medicare?
Medicare doesn’t start until 65. If you retire at 60, you have a five-year “ACA bridge” — buying coverage on the marketplace and paying real money for it. We estimate the cost (the silver-plan benchmark, net of the premium tax credit you’d qualify for at your projected retirement income) so the gap isn’t a $50,000 surprise that wrecks an otherwise solid plan. See the full ACA-bridge breakdown →
Net worth trend
Is my net worth heading the right way?
Multi-year history with month-over-month deltas, top movers per account, and the running answer to “are we still on track?” The Net Worth view doesn’t just show today’s number — it shows the trajectory, and tells you when the trajectory has changed direction.
HSA planning
How much HSA room is left, and what is it worth?
The HSA page shows the tax-year limit, coverage tier, employer and employee contributions already made, age-55 catch-up, and a marginal-rate estimate of the upfront tax value. Eligibility assumptions stay visible: qualifying HDHP, no disqualifying coverage, no Medicare enrollment, and full-year eligibility unless your CPA handles a mid-year edge case. See the HSA calculator →
Tax-loss harvesting
Which taxable lots are sitting at a loss?
The scanner stays conservative: taxable accounts only, wash-sale risk surfaced, unknown acquisition dates excluded, and tax-advantaged accounts kept out of the harvest number. It shows the planning facts without naming replacement securities or turning the app into a trading desk. See the scanner →
Insurance coverage gap
Is the household protected if income stops?
The insurance room pairs policy breadcrumbs with a simple needs estimate: life income replacement, debts, and future goals less assets and existing coverage; disability essentials less after-tax benefits. No carrier ranking, no quote, no product pitch. See the coverage-gap calculator →
Cascading what-if simulator
What does ONE decision actually do across my whole plan?
The Mike scenario below ("pay off a card, redirect to 401(k)") used to be paper math. Now it’s live in the app. On the Balance Transfers page, every active BT has an inline "what if I cleared this and put the dollars in retirement?" panel showing three numbers computed against your real data: tax savings this year at your marginal rate, future value of the freed-up dollars at retirement (compounded), and the change in your Monte Carlo success probability. One decision, three lenses, all updated in seconds. The first feature where the math visibly ripples across pages — and the model for what’s next.
Explain Mode
…and we show our work, on every number.
Every projection comes with the assumptions feeding it, the formula, and the caveats — written in plain English. Hover any (?) icon for the methodology, or toggle “Explain Mode” in the top bar to keep them all open while you browse. The numbers should defend themselves; you shouldn’t have to take them on faith.
Resources & guides
When a number points at an IRS rule, we walk you through it.
Every planning topic links to the official IRS, SSA, and Medicare pages — and for the densest ones we add our own plain-English guide (what the page is, how to use it, what to look for), plus a glossary for the scary terms. And when you’re ready to act on what you’ve explored, a neutral way to find and vet a fee-only fiduciary. The IRS doesn’t have to be intimidating.
See it in action.
A live net-worth chart, then a guided walk through the retirement answer it builds toward — a fictional 42-year-old household planning to retire at 65, Pat & Jordan Acme.
Liquid + retirement + real estate, less loans & cards. Updates as you snapshot balances.
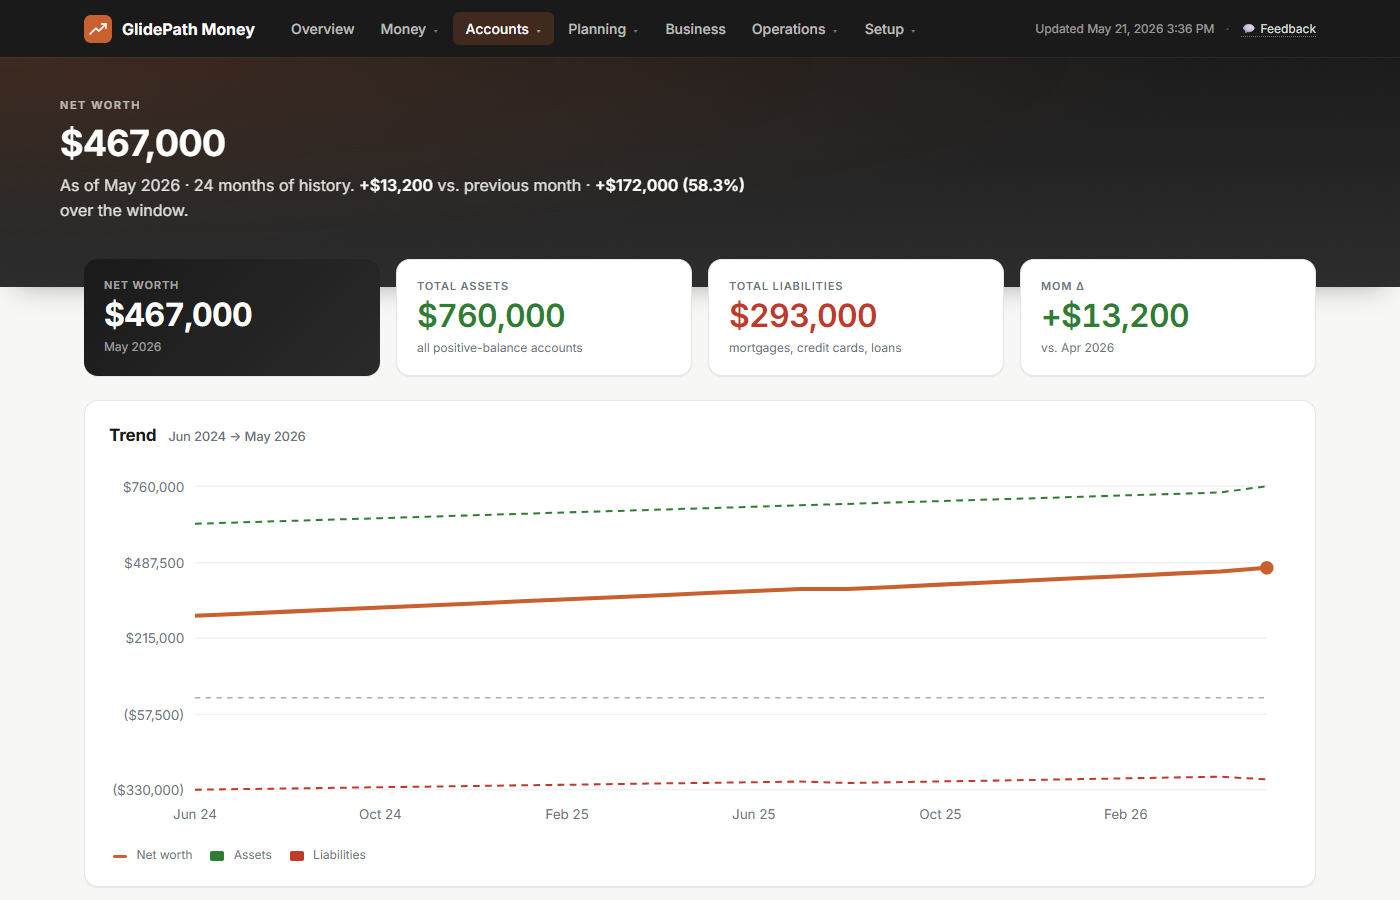
Watch the trajectory tilt up as retirement compounds and the mortgage balance falls.
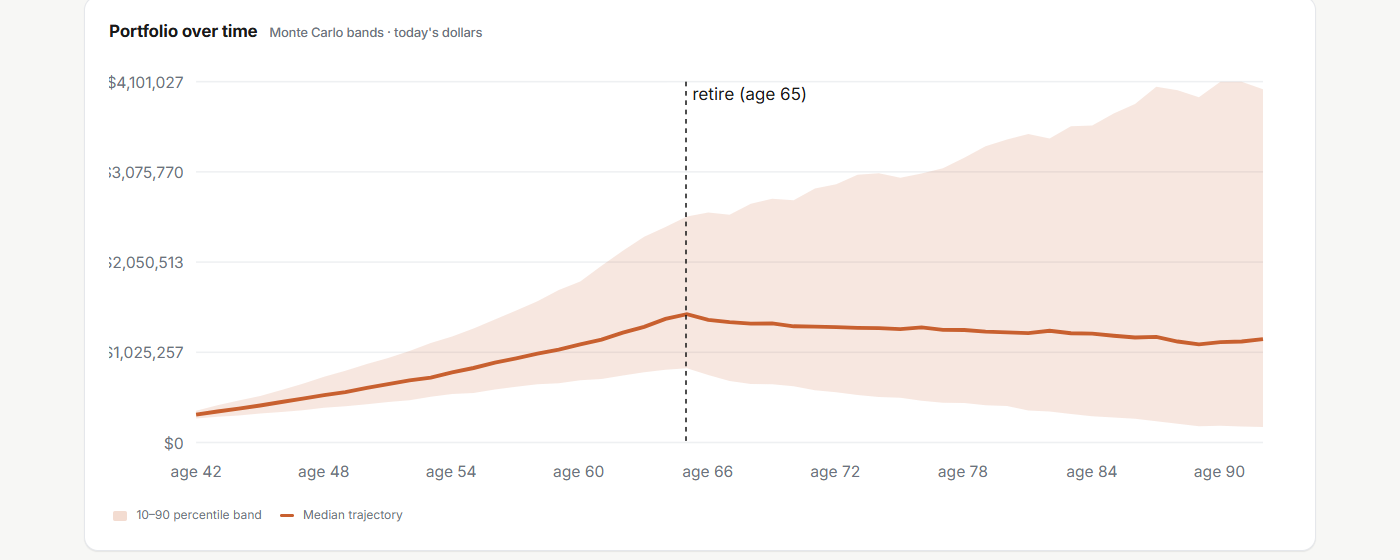
- Outlook — the success read Out of 1,000 randomized market futures, the share that reach the end of the plan with money left. The honest “will I be okay?” number.
- The hardest 10% The stress read behind the headline — even the hardest tenth of futures is checked for money past the planning horizon.
- At retirement What the plan projects you’d hold on retirement day, in today’s dollars — read against the spending reference beside it, not a rosy best case.
- Runway reference A plain yardstick — 25× the annual spending target — shown next to the projection so the comparison and its assumption stay on screen.
Retiring before 65 means buying your own health coverage until Medicare starts. GlidePath sizes that gap from your plan — the out-of-pocket cost, the ACA premium tax credits (the subsidies that lower a Marketplace plan) that might offset it, and where your income crosses the subsidy cliff.
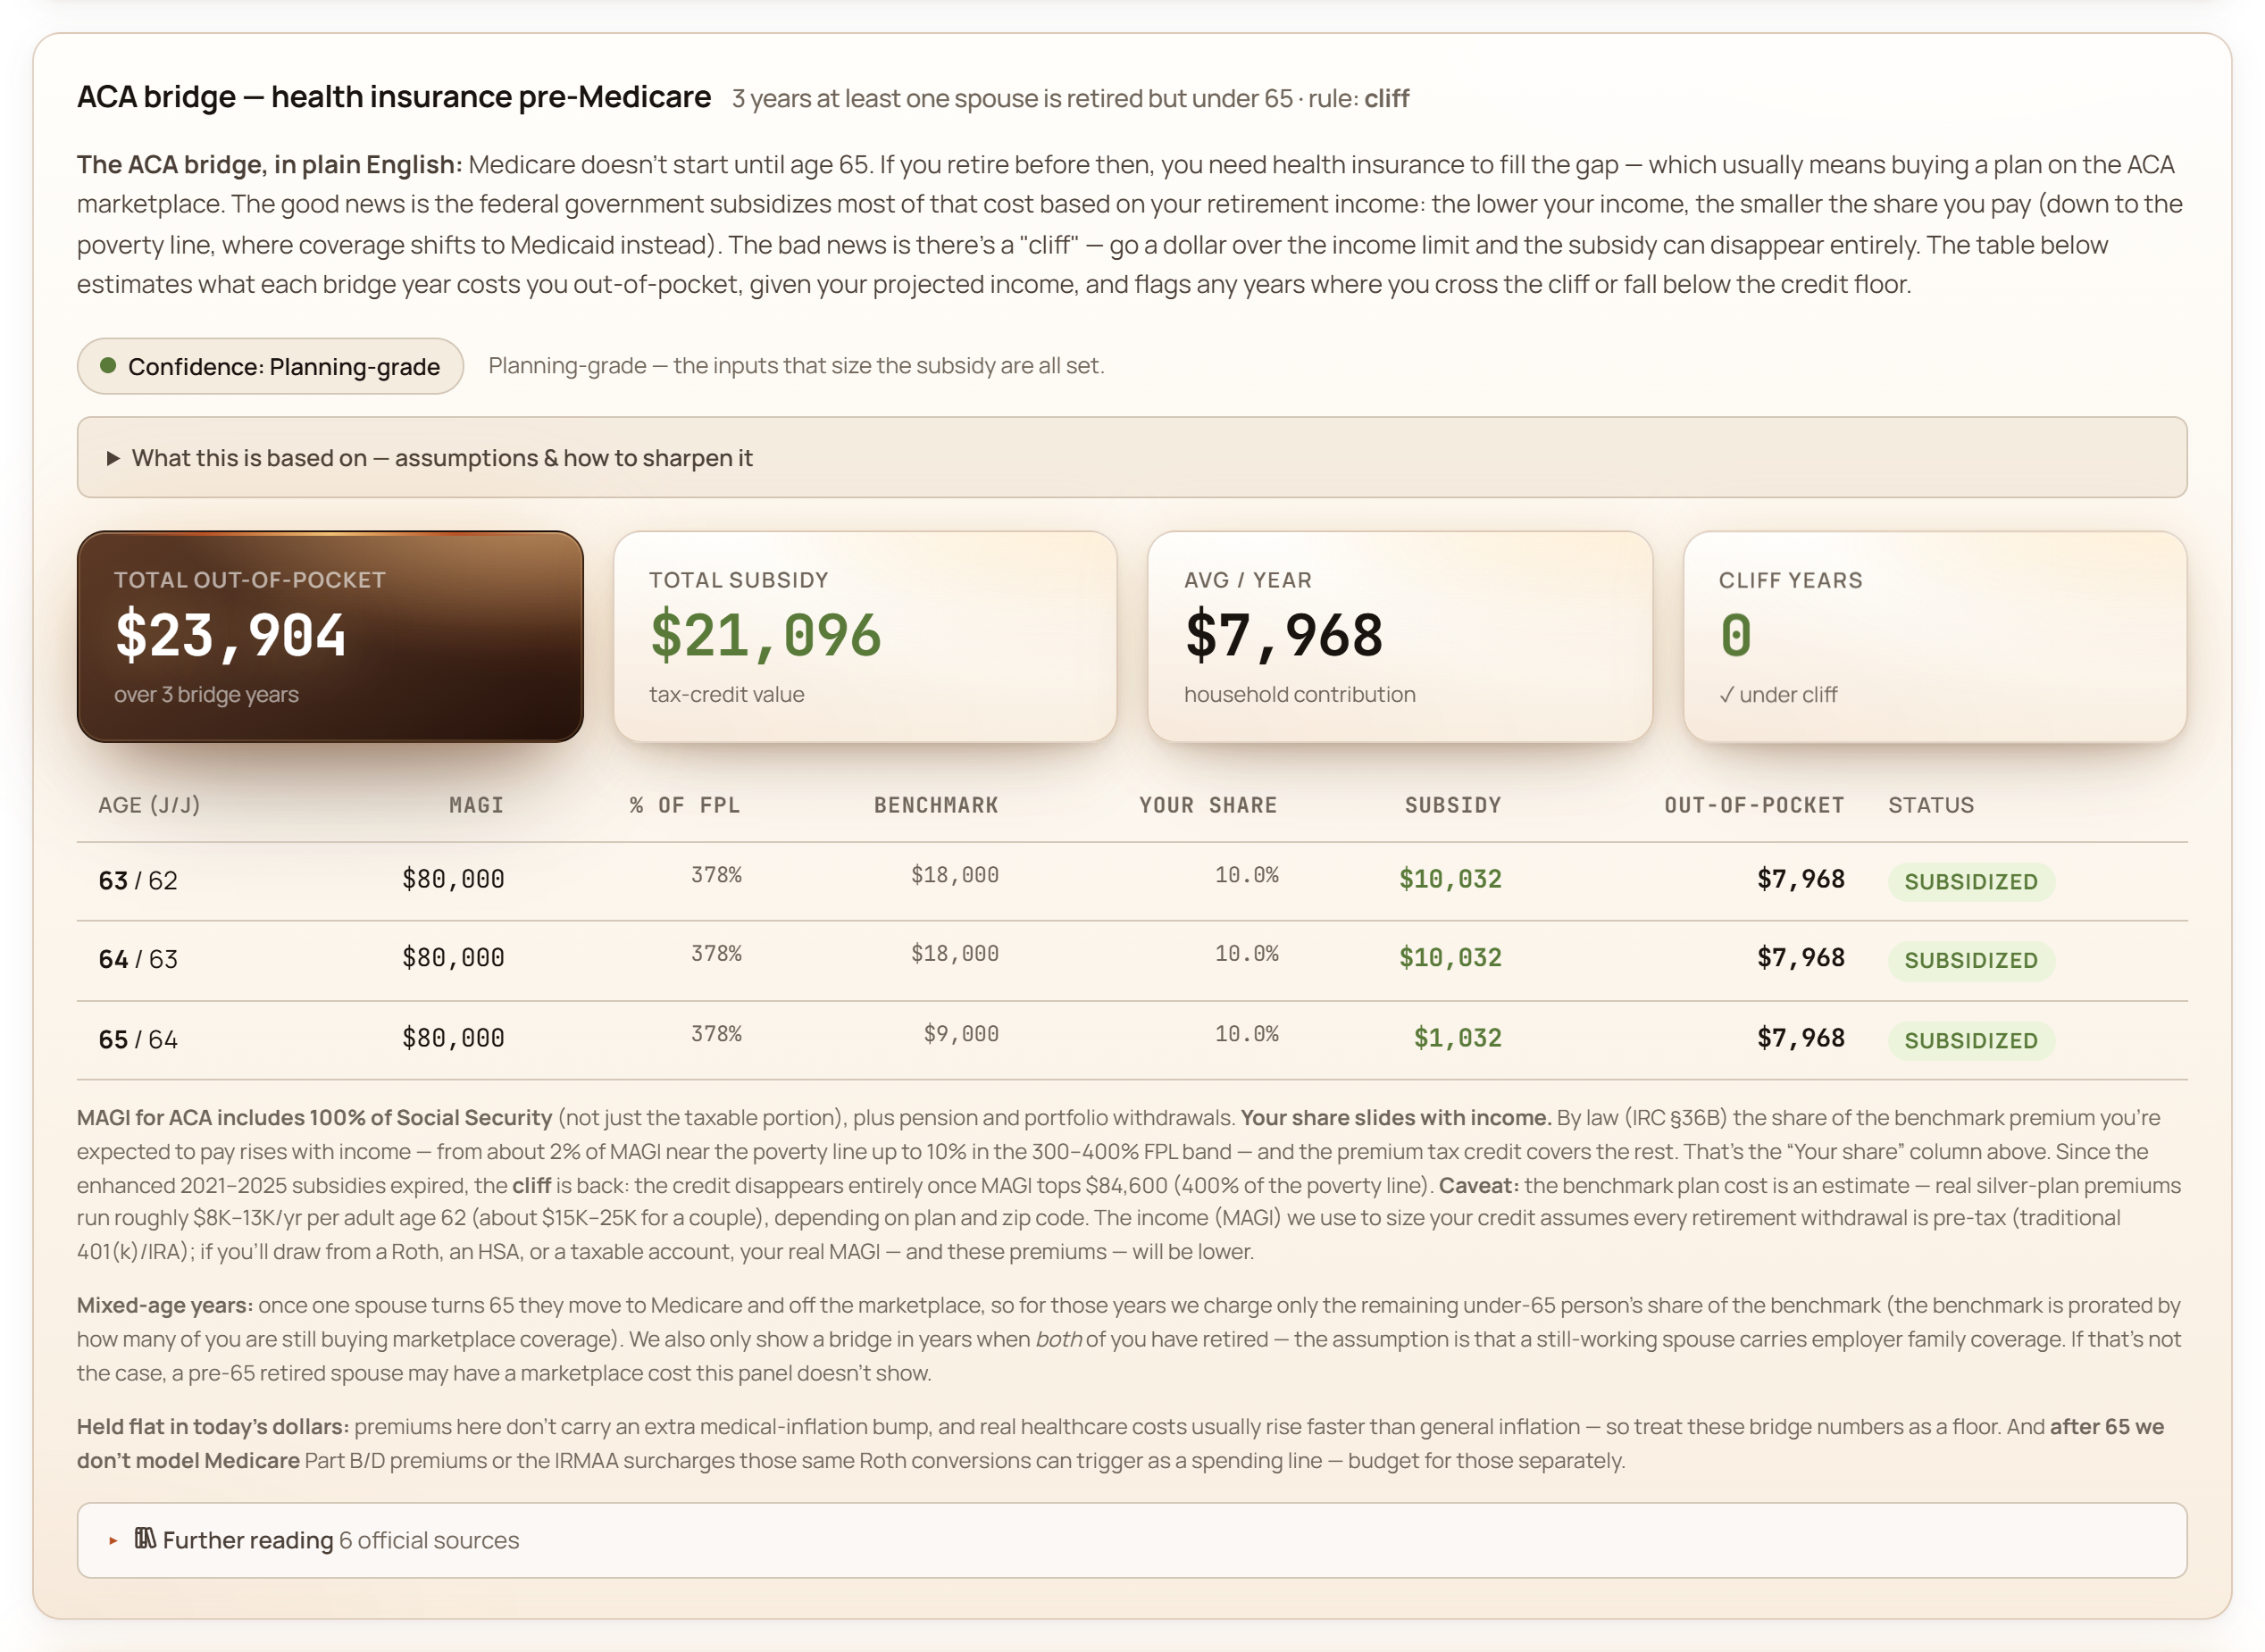
Modeled from your own retirement ages and income, with each figure traceable to its source.
Your finances are connected. So is the app.
Most personal-finance tools treat your credit cards, your 401(k), and your retirement plan as separate dashboards. They’re not. GlidePath stores everything as one shared ledger — so when you make a real change to any input (a card balance, a monthly contribution, a retirement assumption), every page that depends on it updates with you. Three stories where that matters.
Mid-career: a $5,000 card paid off 6 months early Mike, 42 · married · two kids · $180K in 401(k)
Mike has a 0% APR card with a $5,000 balance and 6 months left in the promo. He’s on track to make minimum payments. The Balance Transfers page shows him the countdown and the monthly clear pace; he wants to know what accelerating it would actually earn him. Here’s the math he’d work through and where each piece shows up:
- Card balance: $5,000 → $0 (6 months sooner)
- Freed-up monthly cash flow redirected to 401(k): $833/month × 6 = $5,000
- Tax savings this year at his 22% marginal bracket: +$1,100
- Future value of that $5,000 at 7%/yr for 23 years to retirement: ~$24,000
- Retirement Monte Carlo success probability: +1–2 percentage points
The decision lives on Balance Transfers. The impact lives on Net Worth, Cash Flow, and Retirement. Once Mike actually makes the move and updates the balance, every one of those pages reflects the new reality without any extra work — same ledger, three lenses.
Early career: an extra $200/month into a Roth IRA Sarah, 27 · just paid off student loans · $30K in 401(k)
Sarah just got a raise and is debating whether to bump her Roth contribution by $200/month. It feels small. She updates her annual contribution on the Retirement inputs and watches the Monte Carlo recompute:
- Annual contribution increase: +$2,400
- Time horizon to age 65: 38 years
- At 7%/yr average return, future value of those contributions: ~$450,000
- Total she actually contributed: $91,200 (the rest is compounding)
- Retirement Monte Carlo: shifts from “comfortable” to “well-prepared”
A “tiny” line item on Cash Flow becomes a six-figure outcome on Net Worth and Retirement. Same input, three views — so she can see the magnitude before she commits to the new contribution rather than discovering it a decade later.
Pre-retirement: delaying Social Security and timing Roth conversions Linda, 61 · single · $850K in 401(k) · retiring at 63
Linda is two years from retirement. The common default ("claim SS at 67, retire when you're ready") isn't always the best fit for a situation like hers. GlidePath lays out the three connected decisions so she can see how they interact — here's what the page actually shows her.
- Social Security timing. Her benefit at 62, 67, and 70 side by side (claiming at 70 is +24% over 67) — each with its own Monte Carlo success probability and median ending balance.
- The Tax Valley. The low-bracket years between retiring and RMDs, with how much she could convert from her 401(k) to a Roth each year before crossing into the next bracket — plus a directional tax comparison against later RMD-driven withdrawals (at 75).
- The ACA bridge. Her pre-Medicare health-insurance cost (~$28K over the 63–64 bridge), computed and rolled into the Monte Carlo.
These decisions interact — SS timing changes her income, which changes her Tax Valley headroom and her ACA subsidy. Change one assumption on the Retirement page and the others respond. (GlidePath shows the analysis; what to actually do is a conversation for you and a fiduciary or CPA.)
The unifying idea: your dashboard isn't five views of five things — it's one view of one financial life, expressed five different ways.
Ready to see your own numbers?
$129 desktop license. Your data on your computer the whole time. Stop maintenance any time — your installed version keeps working and every file you've built up is still yours.
Social Security
Claim Social Security at 62, 67, or 70?
The basic tradeoff: claim early, get less per month for life. Wait, get more — but for fewer years. We run the lifetime real-dollar totals side by side, including spousal and survivor math when you’re claiming as a couple. The better-fit claiming age depends on your earnings history, lifespan expectation, marital picture, and what other income you have. See the 62 vs 67 vs 70 break-even →